Table of Contents
- Mortgage Delinquency Rates Lowest in a Decade
- 10 Years After the Housing Crash
- So What’s Driving Today’s Hot Housing Market?
- Builder Confidence Close to Post-recession High
- Homeownership Headwinds; New Tax Plan Affects
- Affordability crisis for First Time Home Buyers
- U.S. Consumer spending grows at fastest pace since 2009
- Southland Home Prices stay White Hot
- New Home Sales up 18.9% – shocking analysts
- Lack of New Home Building and High Construction Costs Fuel the Affordable Housing Shortage
- 67 Straight Months of Home Price Gains on Year-Over-Year Basis
- “Home Prices Getting Interesting Since Last Bust – Colorado Prices Now 42% Higher Than Last Peak”
- “Is the Mortgage Interest Deduction Going Away?”
- “Nearly Half of The Nations Largest 50 Markets Are Overvalued,” – CoreLogic
- Housing Consumer Optimism Abounds; Homeowners’ equity continues to improve
- Los Angeles County Home Prices Surge to a New Record of $580,000
- Building Permits Rise: Housing Starts Stall; Investors Flipping Fewer Homes
Mortgage Delinquency Rates Lowest in a Decade
According to CoreLogic’s recent Loan Performance Insights report, 4.6% of mortgages nationally in August were in some stage of delinquency (30 days or more past due including those in foreclosure). This was a 0.6% point decline on a year-over-year basis in the overall delinquency rate compared to August 2016 when it was 5.2%.
The foreclosure inventory rate, which measures the share of mortgages in some states of the foreclosure process, was 0.6% in August, down from 0.9% in August 2016. This was the lowest foreclosure inventory rate for the month of August in 11 years since August 2006 when it was 0.5%.
Frank Martell, President and CEO of CoreLogic stated, “Serious delinquency and foreclosure rates are at their lowest levels in more than a decade, signaling the final stages of recovery in the U.S. housing market. As the construction and mortgage industries move forward, there needs to be not only a ramp up in homebuilding but also a focus on maintaining prudent underwriting practices to avoid repeating past mistakes.”
In other mortgage-related news, the Mortgage Bankers Association (MBA) says that information collected through its Builder Application Survey shows mortgage applications for new home purchases rose 23% from September to October.
Lynn Fisher, MBA’s Vice President of Research and Economics said, “October registered the strongest growth rate in applications so far this year, following September’s hurricane-related decrease.”
By loan product type, conventional loans were 71.8% of applications, FHA loans 15.1%, VA loans 11.7%, and RHS/USDA loans 1.4%.
10 Years After the Housing Crash
Can you believe it’s been 10 long years since the housing crash that occurred on the eve of the Great Recession? Well, the good times are here again, and that’s causing some concern and reflection in the housing market as home prices hit all-time highs again.
In fact, the U.S. median home sales prices in 2016 were $236,000, 2% higher than in 2006, and 31 of the 50 largest U.S. metros are back to pre-recession levels. Some markets have seen home prices skyrocket – Austin, Texas, has experienced the largest price growth in the past decade at 63%, followed by Denver, Colorado at 54%, and Dallas,
Texas, at 52%. For most of 2017, listing prices across the nation have been up by double digits as well. “As we compare today’s market dynamics to those of a decade ago, it’s important to remember rising prices didn’t cause the housing crash,” stated Danielle Hale, Chief Economist for realtor.com. “It was rising prices stoked by subprime and low-documentation mortgage, as well as people looking for short-term gains – versus today’s truer market vitality – that created the environment for the crash.”
One of the biggest changes in housing since the last crash is that lending standards are the tightest they have been in nearly 20 years. The Dodd-Frank Act, which was passed to limit risky lending practices, now requires loan originators to show proof that a borrower can indeed repay the loan. As a result, the median home loan FICO score was 734 in 2017, compared to only 700 in 2006.
So What’s Driving Today’s Hot Housing Market?
Most notable is the record-low unemployment rate, which hit a 17-year low in October at 4.1%. Additionally, the stock market continues to show strength and confidence and mortgage rates are still historically low.
The main constraints on housing remain affordability and inventory – prices have moved up fast and the lack of available inventory remains constant.
The coming year should provide clues as to where we are in the cycle and how much fuel we have left in the tank to continue to propel the market forward. Economists are predicting continued price appreciation in the next 12 months in the 5% range, so optimism remains.
Builder Confidence Close to Post-recession High
Builder confidence has increased for the second consecutive month according to the National Association of Home Builders (NAHB)/Wells Fargo Housing Market Index (HMI), hitting its highest level since March and reaching its second-highest reading since July 2005.
“November’s builder confidence reading is close to a post-recession high – a strong indicator that the housing market continues to grow steadily,” said NAHB Chairman Granger MacDonald. “However, our members still face supply-side constraints, such as lot and labor shortages and ongoing building material price increases.”
NAHB Chief Economist Robert Dietz added, “Demand for housing is increasing at a consistent pace, driven by job and economic growth, rising homeownership rates and limited housing inventory. With these economic fundamentals in place, we should see continued upward movement of the single-family housing market as we close out 2017.”

Homeownership Headwinds; New Tax Plan Affects
According to a new report issued by the National Association of Realtors (NAR) on the hurdles of homeownership, the many positives for housing that should be a catalyst for increasing home sales continue to face headwinds with inventory shortages and the passage of a tax bill that could be a disincentive for homeownership.
NAR Chief Economist Lawrence Yun stated, “Despite considerable demand all year, pending sales have lost a step in recent months because low supply is pushing prices higher and making home buying less affordable in several parts of the country. The lack of inventory has pushed up home prices by 48% from the low point in 2011, while wage growth over the same period has been only 15%.”
Yun expects single-family housing starts to jump 9.4% to 950,000 next year, but that remains well below the 50-year average of around 1.2 million starts. New single-family home sales are likely to hit 606,000 in 2017, and rise to around 690,000 in 2018. He also forecasts price increases of around 5.5% both this year and next.
And what about the proposed new tax plan and its affect on home sales?
During the recent Realtors Conference and Expo & 2018 Housing Forecast, Yun, along with Ken Rosen, chairman of Rosen Consulting Group and UC Berkeley’s Fisher Center for Real Estate and Urban Economics, cautioned that the proposed new legislation could very well affect home sales and prices next year and into the future. They called the tax bill “a direct tax hike on homeowners,” and said it essentially eliminates the homeownership incentive for all but the top 5% of tax filers. According to NAR’s analysis, it could negatively affect home values by about 10% and raise taxes on middle-class homeowners by an average of $815.
The bill is expected to hit heavy resistance from various lobbying groups. As it relates to real estate, the proposed tax plan would:
• Cap the mortgage-interest deduction on new home sales at $500,000, versus the current $1 million for couples filing jointly
• Cap deductions for state and local property taxes at $10,000 and repeal other state and local tax deductions
Affordability crisis for First Time Home Buyers
According to the just-released National Association of Realtors (NAR) annual Profile of Home Buyers and Sellers, first time home buyers continue to stay on the sidelines due to the acceleration of home price increases and lack of available inventory. The share of first-time buyers dipped to 34% of homes from 35% in 2016, which is the fourth lowest share in the history of the survey (the survey has averaged a 39% share for the last 36 years).
“The dreams of many aspiring first-time buyers were unfortunately dimmed over the past year by persistent inventory shortages, which undercut their ability to become homeowners,” stated NAR Chief Economist, Lawrence Yun. “With the lower end of the market seeing the worst of the supply crunch, house hunters faced mounting odds in finding their first home. Multiple offers were a common occurrence, investors paying in cash had the upper hand, and prices kept climbing, which yanked homeownership out of reach for countless would-be buyers.”

U.S. Consumer spending grows at fastest pace since 2009
The Commerce Department reported that U.S. consumer spending recorded its biggest increase in more than eight years in September. Consumer spending, which accounts for more than two-thirds of U.S. economic activity, jumped 1% last month, buoyed by purchases of automobiles and big-ticket items.
Households, however, dipped into their savings accounts to fund purchases in September, pushing savings to their lowest level since 2008. With spending outpacing income, savings fell to $441.9 billion last month, from $521.4 billion in the prior month. The savings rate was 3.1%, the lowest level since December 2007.

Southland Home Prices stay White Hot
Home prices in Southern California tied an all time high in September – hitting levels not seen since 2007. The median price for the six-county region climbed nearly 10% to $505,000 from a year earlier, as reported by data firm CoreLogic. That matches the peak median price level reached in 2007, before the housing market bust and subsequent great recession. The continued surge in pricing elevates concerns over housing affordability. In fact, some counties have already seen home prices surpass their previous all time highs. Take Los Angeles, the median price last month was $575,000, up 9.5% from a year earlier and $25,000 higher than the peak in 2007.
In Orange County, home prices continue to reach new highs as September’s median was $710,000, up almost 11% from last year and $25,000 over August’s median of $685,000, which is the sixth-biggest one-month price gain in records dating back to 1988. California’s five-year run of rising home prices is expected to last another three to five years, with median house prices already at or above highs set during the housing bubble. The California Association of Realtors (CAR,) forecast home prices will increase an additional 4.2% in 2018. If the forecast proves accurate, the single-family home price will exceed the record high set in 2007.
While roughly half of Californians could afford the median-priced house when the market recovery started in 2012, only 26% will be able to afford a single-family detached home in 2018, according to the CAR forecast.
CAR Chief Economist Leslie Appleton-Young said “It’s so odd to look at this in an environment where you’ve seen such rapid job growth and income growth and low-interest rates. A lack of inventory and affordability…are really keeping a lid on the California housing market. We have
fewer transactions…today than when we had 10 million fewer people living in California.” Appleton-Young added, “I know that this cycle will not last forever. I would guess we’ve got maybe three to five more years where things can eke out the kind of increases that we’ve seen over the past couple of years.”
The wildcard, of course, is mortgage interest rates. CAR expects mortgage interest rates to rise slightly next year, but not enough to deter homebuyers. Rates for traditional 30-year, fixed mortgages are forecast to rise to 4.3% in 2018. That’s still low compared to historical averages, but up from 4% this year and 3.6% in 2016.
New Home Sales up 18.9% – shocking analysts
Analysts had predicted that new home sales would fall again in September, this coming after a 9.4% loss in August, but were shocked to see the September results. According to the U.S. Census Bureau and the Department of Housing and Urban Development, sales of newly constructed single-family homes rose 18.9% in September month-over- month and 17% above the September 2016 number.
There were 52,000 new homes sold during September versus 45,000 in August, with the average time on market since completion at 3.2 months.

Lack of New Home Building and High Construction Costs Fuel the Affordable Housing Shortage
According to REDFIN, without affordable new construction, the housing market will continue to be marked by low inventory, high prices and bidding wars – with first-time home buyers often bearing the brunt and being priced out of the market all together.
The average price of a new construction home that sold in the three months through September 2017 was $374,000 – an average premium of $87,000 compared with existing homes.
Meanwhile, the national average cost to build a new home, which includes the estimated labor cost plus construction materials, came in at $240,000 for single-family dwellings in August – the highest since the U.S. Census began reporting it in 1988.
Contributing to rising construction costs and the lack of available construction workers, which is still 25% below the peak in 2006. The labor shortage has only magnified by the recent hurricanes.
To make matters worse still, the recent fires in Northern California has destroyed at least 8,400 homes and other buildings, a staggering loss of property, which has displaced about 100,000 people in the area.
Of all the states, California continues to exemplify the nation’s housing affordability crisis. In fact, California has build the fewest number of apartments and for-sale units per new resident of all states between 2010 and 2016, with just one unit for every four new residents. By contrast, the average is more that double in other states at one new unit for every 1.8 residents during the period, which is still lower than the 1.6 average of the 1990s.
67 Straight Months of Home Price Gains on Year-Over-Year Basis
According to the National Association of Realtors (NAR) recent existing home sales report, ongoing supply shortages and recent hurricanes cause sales decline on an annual basis. Last month’s sales pace is 1.5% below a year ago and is the second slowest over the past year (behind August). This comes after three straight monthly declines.
NAR Chief Economist Lawrence Yun stated, “Home sales in recent months remain at their lowest level of the year and are unable to break through, despite considerable buyer interest in most parts of the country. Realtors this fall continue to say the primary impediment stifling sales growth are the same as they have been all year; not enough listings – especially at the lower end of the market – and fast rising prices that are straining the budgets of prospective buyers.”
The median existing home price for all housing types in September was $245,100, up 4.2% from September 2016 – that marks the 67th straight month of year-over-year gains. First-time home buyers were 29% in September, which is down from 31% in August, 34% a year ago, and matches the lowest share since September 2015. All cash sales represented 20% of transactions in September, while distressed sales were 4% of total sales. The median price in the West was $362,700, up 5.0% from September 2016.
“Home Prices Getting Interesting Since Last Bust – Colorado Prices Now 42% Higher Than Last Peak”
A new report by CoreLogic’s principal economist Molly Boesel comparing housing booms and busts reveals some interesting data at a time when home prices are nearly back to where they were when the housing crisis began. After hitting a pricing peak in 2006, the national price level fell for five straight years, finally reaching bottom in March 2011 (although most other sources set the date for the bottom nearly a year earlier, these numbers may indicate they are using inflation adjusted numbers).
From peak to trough, home prices fell 33% nationally, and as of July 2017, CoreLogic data shows that home prices were approximately at 2006 levels. Interestingly, Boesel’s report compares these numbers to those of the Teas oil bust in the mid 1980’s, which resulted in a 16% decline in home prices over 3.5 years, while the peak to recovery cycle took about nine years. In addition, California’s defense and manufacturing job losses in the 1990s led to steep price declines in the state, with prices falling 15% over 5.5 years, and taking about eight years to fully recover.
Comparatively speaking, the U.S. home price decreases that started in 2006 were twice as severe as these two regional declines.
While home prices nationally are close to their peak, the recovery looks very different from state to state. Take Nevada, where prices dropped a record 60%, is still in recovery mode as home prices here are still 27% below its March 2006 peak. Colorado, on the other hand, saw prices fall 14% from its peak in 2007, but today prices have now surpassed that peak by 42%. Overall, 34 stats are now above their pre-crisis home price levels.
In other housing news, a report by the National Association of Home Builders (NAHB) showed that single-family homes started in 2016, the median prices per square foot, excluding improved lot values, ranged from $164 for contractor-built homes in the Pacific division to $81 for speculatively built homes in the East South Central division. At $164 per square foot, new contractor-built single-family homes in the Pacific region are the most expensive to build, exceeding the national average of $101 per square foot by more than 60%. Typically, contractor-built custom homes are more expensive per square foot than spec homes after excluding improved lot values, which indicates that new custom home buyers are willing to pay more for high-end features and materials and wait longer to move into the new home. The NAHB estimates are based on the Survey of Construction (SOC) data.
“Is the Mortgage Interest Deduction Going Away?”
The Mortgage Interest Deduction (MID) has traditionally been one of the most sacred cows in the U.S. tax code, and now there appears to be a rift between two very influential lobbying groups – the National Association of Realtors, (NAR) and the National Association of Home Builders, (NAHB.) After 75 years of overwhelming support for the MID, the National Association of Home Builders is abandoning its defensive posture, while NAR is standing tough with its support.
While little is known about the Trump administration and Republican congressional tax reform plans, under the current version, the MID would not go away, but its utility would be reduced considerably. It’s estimated that under the proposed tax reform, the mortgage interest deduction would only be applicable to 5% of U.S. homes, according to Zillow. Look for this topic to be hotly debated in the near future, as the proposed tax reform plan is more defined.

“Nearly Half of The Nations Largest 50 Markets Are Overvalued,” – CoreLogic
According to its recent Home Price Index report released by CoreLogic, home prices continued to post strong gains in August – moving up 0.9% on a month-over-month basis, the same gain it posted from June to July. On an annual basis, home price appreciation increased from 6.7% in July to 6.9% – the largest year-over-year gain since a 7.1% increase posted in March. The highest rate of appreciation among metropolitan areas was Las Vegas, up 8.4%, and Denver, which rose by 8.3%.
“Nearly half of the nation’s largest 50 markets are overvalued,” stated Frank Martell, President and CEO of CoreLogic. “The lack of real estate affordability has spread beyond the typically expensive coats into the interior of the nation, hitting cities such as Denver, Nashville, Austin and Dallas.” CoreLogic’s Chief Economist, Dr. Frank Nothaft, added, “While growth in home sales has stalled due to a lack of inventory during the last few months, the tight inventory has actually helped stabilize price growth. Over the last three years, price growth in the CoreLogic national index has been between 5 percent and 7 percent per year, and CoreLogic expects home prices to increase about 5 percent by this time next year.”
In other housing news, construction spending in August came in a bit higher than expected, posting an increase for the first time in three months, according to the U.S. Census Bureau. Total construction spending for August was at a seasonally adjusted annual rate of $1.22 billion, an increase of 0.5% from the revised estimate of $1.21 billion in July and 2.5% ahead of spending in August 2016. Residential spending is 11.6% ahead of August 2016, with single-family construction up 0.3%, which is 11.1% higher that a year earlier.
Finally, a Survey of Construction (SOC) study from the U.S. Census Bureau found that the median lot size of a new single-family detached home sold in 2016 was 8,562 square feet – a new record low. While the nation’s lot sizes are getting smaller on average, they differ widely per region. The Pacific division, where densities are high and developed land is scarce, lot sizes are the smallest with half of the lots being under 0.15 acres (compared with New England, which had more than half of the lots exceeding a third of an acre at 0.37 acres).
Housing Consumer Optimism Abounds; Homeowners’ equity continues to improve
According to the National Association of Realtors (NAR) third quarter Housing Opportunities and Market Experience (HOME) survey, consumers remain confident about the direction of the national economy and about their own finances. With the continued appreciation of home prices, it’s no surprise that the share of homeowners that believe now is a good time to sell is moving higher. In fact, 80% (a survey high) of homeowners said this is a good time to list their home for sale, up from a second quarter total of 75%, and 13% above the same response in the third quarter in 2016.
Renters, undeterred by higher home prices, believe that this is a good time to buy a home, rising from 52% of renters last quarter to 62%, which is slightly higher than a year earlier. Overall, 57% of survey respondents believe the economy is improving compared to 54% in the second quarter and 48% a year ago. NAR Chief Economist Lawrence Yun says, “Jobs are plentiful, wage growth is finally showing signs of life, home values are up considerably in the past five years, and the stock market is at record highs. The economy is not perfect, and growth overall is still sluggish, but the financial health of the typical household looks as healthy as it has since the recession.”
In other housing news, a new Financial Accounts of the United States report published by the Federal Reserve for the second quarter of 2017 shows an improved balance sheet of U.S. households with real estate holdings. Households’ owner-occupied real estate increased to $23.8 trillion in the second quarter of 2017, $1.597 billion more that the same period of 2016. The value of owner’s equity, the difference between the value of owner-occupied real estate and home mortgage debt, rose to $13.9 trillion over the second quarter of 2017. In nominal terms, owner’s equity has returned to its pre-recession peak level. However, in contrast to the housing boom era, mortgage debt growth remains subdued.
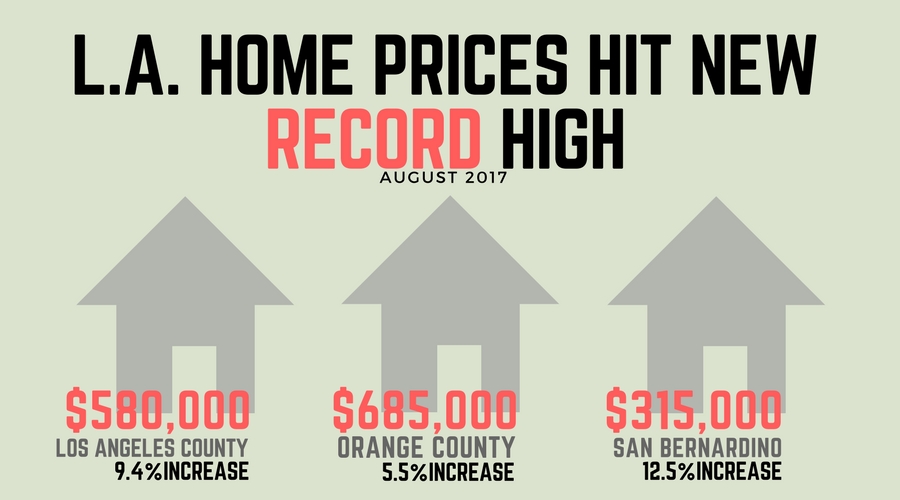
Los Angeles County Home Prices Surge to a New Record of $580,000
With Fall fast approaching in Southern California, the real estate market continued to stay hot as median home prices increased 7.5% in August from a year earlier. The recent home price gains continue to stoke the affordability flame in California, as recent polls show widespread concern coupled with a stubborn lack of available homes for sale.
As reported by CoreLogic this week, the median price surged 9.4% in Los Angeles County to a record $580,000 (the previous record was $575,000 set in July). Consequently, it was the best August for home sales since 2006.
Additionally, home prices for the six-county region in August came in just below the all-time high of $505,000 reached in 2007 at the height of the housing bubble. Economists project that home price increases will probably moderate between a range of 3% to 5% annually for the foreseeable future as the current 7% per year increases are unlikely to sustain.
Median Price gains in August 2017:
Los Angeles County
San Bernardino County
Riverside County
San Diego County
Ventura County
Orange County
$580,000 – 9.4% Increase
$315,000 – 12.5% Increase
$365,000 – 7.7% Increase
$535,000 – 7.4% Increase
$567,999 – 6.0% Increase
$685,000 – 5.5% Increase
Finally, consumers are increasingly nervous about the housing market as a new statewide poll by the Institute of Governmental Studies at UC Berkeley found that nearly half of the state’s voters (48%) described the housing affordability issue in their area as “extremely serious.” In Los Angeles, the figure was 42% and 65% for those in the San Francisco Bay Area. More concerning, 59% of Angelino’s voters said they considered moving out of the area because of rising housing costs.
Is the real estate market a new house of cards? Have a comment, join in here
Building Permits Rise: Housing Starts Stall; Investors Flipping Fewer Homes
“I’m taking a lot of freestyle music and flipping it.” ~Pitbull
Building Permits on the Rise
According to a recent report released by the U.S. Census Bureau and the Department of Housing and Urban Development, building permits for residential construction are on the rise while housing starts are still struggling. After more than a 4% downturn in July, permits for residential construction were up 5.7% from the previous month, to a seasonally adjusted rate of 1,300,000 units compared to a revised rate of 1,230,000 units. Permitting was strong in the West, up 15.3% from July and 27.0% from the prior August. Overall, building permits are now running 8.3% ahead of their August 2016 rate.
Housing Starts Fall for the Fifth Month!
On the other hand, housing starts declined for the fifth straight month, although the change was a nominal 0.8% compared to July. At the end of August, there were an estimated 1,082,000 housing units under construction, an increase of 1.3% from July and 4.6% from last August. Real estate investors flipped fewer homes during the second quarter as the returns fell for the third consecutive quarter, according to Q2 2017 U.S. Home Flipping report from ATTOM Data Solutions. Home flipping experienced a 5.6% drop for all home sales in the second quarter, or 53,638 single-family homes and condos, down from 6.9% in the first quarter but unchanged from last year.
Flippers Seek Lower-priced Areas
According to the report, a home flip is defined as a property that is sold in an arms-length sale for the second time within a 12-month period, based on publicly recorded sales deed data collected by ATTOM Data Solutions in more than 950 counties accounting for more than 80% of the U.S. population. Not only is home flipping down overall, but the average gross profit from flipping decreased for the third consecutive quarter, falling to $67,516 during the second quarter. This represents a 48.4% return on investment for flippers, down from 49% the previous quarter and 49.6% from the second quarter last year to the lowest level since the third quarter of 2015. Daren Blomquist, ATTOM’s Senior Vice President stated, “Many flippers are gravitating toward lower-priced areas where discounted purchases are more readily available, often due to foreclosure or some other type of distress.
Many of those lower-priced areas also have strong rental markets, giving flippers a consistent pipeline of demand from buy-and-hold investors looking for turnkey rentals.” Blomquist added, “In markets where distressed discounts have largely dried up, flippers are showing more willingness to leverage financing when acquiring properties, often purchasing closer to full market value and then relying more heavily on price appreciation to fuel their flipping profits.”
Current Affordability Bubble?
Finally, a new study from the National Association of Realtors and nonprofit American Student Assistance showed that an overwhelming majority of Millennials with student debt do not own a home, with the debt causing a delay of typically seven years. NAR chief economist Lawrence Yun said, “Sales to first-time buyers have been underwhelming for several years now, and this survey indicates student debt is a big part of the blame. Even a large majority of older Millennials and those with higher incomes say they’re being forced to delay homeownership because they can’t save for a down payment and don’t feel financially secure enough to buy.”