As we close out the summer and approach the final quarter of 2018, let’s take a look at some South Bay real estate stats from the period January 1 – September 3, 2018, Single Family Residences.
Areas: El Segundo, Manhattan Beach, Hermosa Beach, Redondo Beach, Palos Verdes Estates, Rancho Palos Verdes, Rolling Hills Estates, Rolling Hills.
“Numbers are the highest degree of knowledge. It is knowledge itself.” ~Plato
| Total # of closed home sales transactions | 1023 |
| Total # of closed sales under $1 million | 99 |
| Total # of closed sales over $5 million | 40 |
| Manhattan Beach Sand Section sales over $5 million | 12 |
| Total # of closed sales over $10 million | 3 |
| Highest closed sale/price per square foot (MB) | $3,180.29 |
| Average days on market to sell | 40 |
| Average year built/closed sales | 1969 |
| Average close sales price | $2,023,563 |
| Average sales discount off list | -1.75% off list |
Year-to-Date Market Trends | South Bay
Single Family Residence | Jan 1 – Sept 3, 2018
| Market Area | 2017 Sold | 2018 Sold | Variance Sold | 2017 Median Close | 2018 Median Close | Variance |
|---|---|---|---|---|---|---|
| El Segundo | 51 | 58 | +7 | $1,275,000 | $1,362,500 | +$87,500 |
| Manhattan Beach | 245 | 218 | -27 | $2,475,000 | $2,450,000 | -$25,000 |
| Hermosa Beach | 71 | 55 | -16 | $1,890,000 | $1,995,000 | +$105,000 |
| North Redondo Beach | 139 | 113 | -26 | $945,000 | $1,100,000 | +$155,000 |
| South Redondo Beach | 69 | 78 | +9 | $1,319,138 | $1,513,500 | +$194,362 |
| Hollywood Riviera | 82 | 62 | -20 | $1,421,500 | $1,465,000 | +$43,500 |
| Palos Verdes Estates | 135 | 131 | -4 | $1,950,250 | $1,849,000 | -$101,250 |
| Rancho Palos Verdes | 274 | 271 | -3 | $1,330,000 | $1,360,000 | +$30,000 |
| Rolling Hills Estates | 56 | 47 | -9 | $1,528,500 | $1,648,000 | +$119,500 |
| Rolling Hills | 13 | 14 | +1 | $2,464,738 | $2,464,738 | +$14,738 |
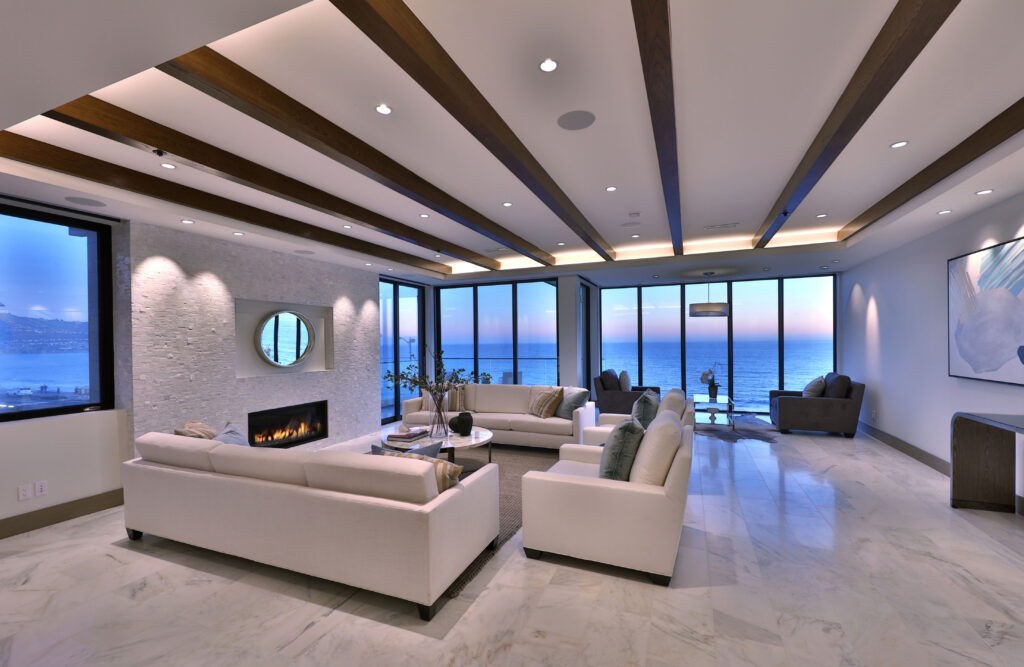
Photography by Paul Jonason
