| City | # Sold | Avg DOM | Avg $ | Median $ | Avg $/SqFt | Highest Close |
|---|---|---|---|---|---|---|
| Manhattan Beach | 342 | 49 | $3.08M | $2.47M | $1080 | $21.0M |
| Hermosa Beach | 107 | 40 | $2.74M | $1.85M | $764 | $14.15M |
| S. Redondo Beach | 112 | 33 | $1.53M | $1.33M | $653 | $2.925M |
| N. Redondo Beach | 197 | 29 | $1.03M | $975K | $624 | $1.89M |
| Hollywood Riviera | 120 | 30 | $1.48M | $1.36M | $703 | $5.92M |
| Palos Verdes Estates | 191 | 54 | $2.25M | $1.88M | $727 | $13.84M |
| Rancho Palos Verdes | 396 | 39 | $1.45M | $1.31M | $573 | $5.50M |
| Rolling Hills Estates | 71 | 58 | $1.71M | $1.57M | $585 | $2.99M |
| Rolling Hills | 19 | 69 | $3.18M | $2.45M | $802 | $6.20M |
| El Segundo | 80 | 38 | $1.31M | $1.27M | $688 | $2.155M |
$4,116,845,572 Worth of Real Estate Sold in South Bay in 2017
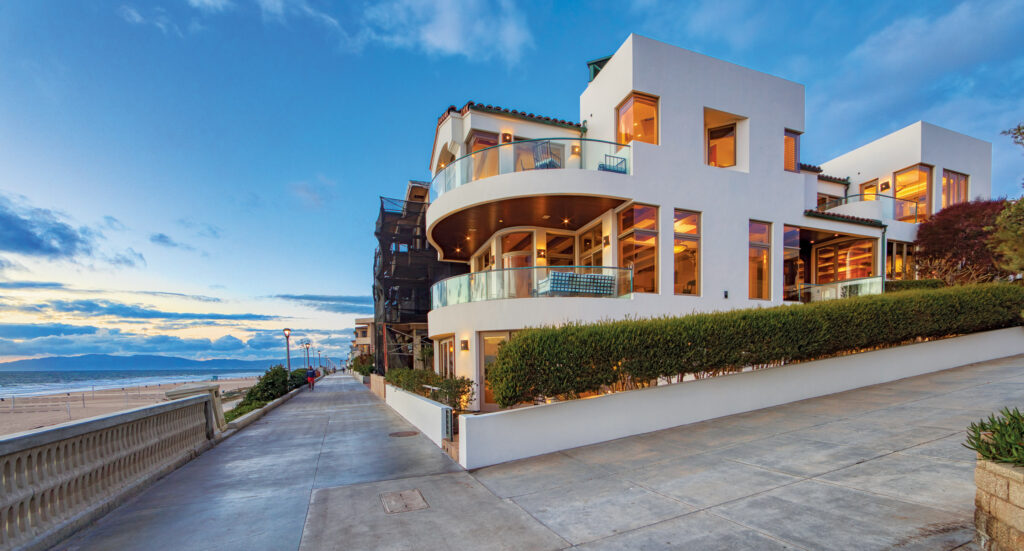
Manhattan Beach also had two record sales over $20 million, as 1000 The Strand broke the all-time high of $21,000,000. Interestingly, of the (11) total closed sales over $10 million in the South Bay, Manhattan had (8) of them (Palos Verdes Estates & Hermosa Beach each had one). Finally, there was (55) total closed sales over $5 million last year, and (114) at or above the $4 million mark!
Looking back, the ultra-high-end slowed a bit towards the middle of 2017 but regained steam to close the year strong. The lack of available inventory was, once again, the big story as buying demand was solid, especially in the under $2 million range. Check out the chart below to see how it looked per city.
Although it is often said that the year ahead will be “interesting,” 2018 might actually be. The outlook for the year is moderate growth in home prices as the economy continues to stay hot—but that could change with the proposed (3) interest rate hikes this year, tax regulation changes, and any stock market correction. And don’t forget the geopolitical landscape, which could change at a moment’s notice.
Beyond what’s happening in the local real estate market, one thing is for sure, it’s sure hard to beat the lifestyle here in the South Bay.
New Median Home Price Record for Los Angeles—71% of Homeowners Think It’s A Good Time To Sell
According to a recently released report by CoreLogic, the median home price in Los Angeles County rose 6.8% in May from a year earlier to reach $560,500 as sales jumped 4.8%. The median home price in Los Angeles has finally surpassed the previous record price of $550,000, which occurred in the summer of 2007 at the height of the housing bubble.
Another major home price indicator, Black Knight Financial‘s National Home Price Index (HPI), further shows that the rate of home price appreciation continues unbridled, as the index reading of $275,000 in April was the highest in the HPI’s history. On an annual basis, the index gained 6.0% in April, compared to 5.8% in March. The average year-over-year increase was 5.6% in the first quarter of 2017 and 5.4% for all of 2016.
April marks 60 consecutive months of annual national home price appreciation. The National Association of Realtors‘ (NAR) quarterly Housing Opportunities and Market Experience (HOME) survey, found that 71% of homeowners think now is a good time to sell, which is up from last quarter (69%) and way up from a year ago (61%.) The report also showed that existing housing inventory has declined year-over-year each month for the past two years.
Additionally, fewer renters think it’s a good time to buy a home, and survey respondents are less confident about the economy and their financial situation than earlier this year despite a healthy job market.
“There are just not enough homeowners deciding to sell because they’re either content where they are, holding off until they build more equity or hesitant seeing as it will be difficult to find an affordable home to buy,” said Lawrence Yun, chief economist at NAR.
“As a result, inventory conditions have worsened and are restricting sales from breaking out while contributing to price appreciation that remains far above income growth.”
Added Yun, “Perhaps this notable uptick in seller confidence will translate to more added inventory later this year. Low housing turnover is one of the roots of the onion supply and affordability problems plaguing many markets.”
Finally, a report released last week from Harvard University’s Joint Center for Housing Studies found that in 2015 nearly 36% of homeowners in Los Angeles County and Orange County spent more than 30% of their income on housing, the upper limit at which costs may become a burden. Interestingly, nearly 17% of homeowners spent more than 50% of their income. Comparatively, only 10.2% of owners spent half their income nationwide.
Photography by Paul Jonason
